Case studies
People Analytics
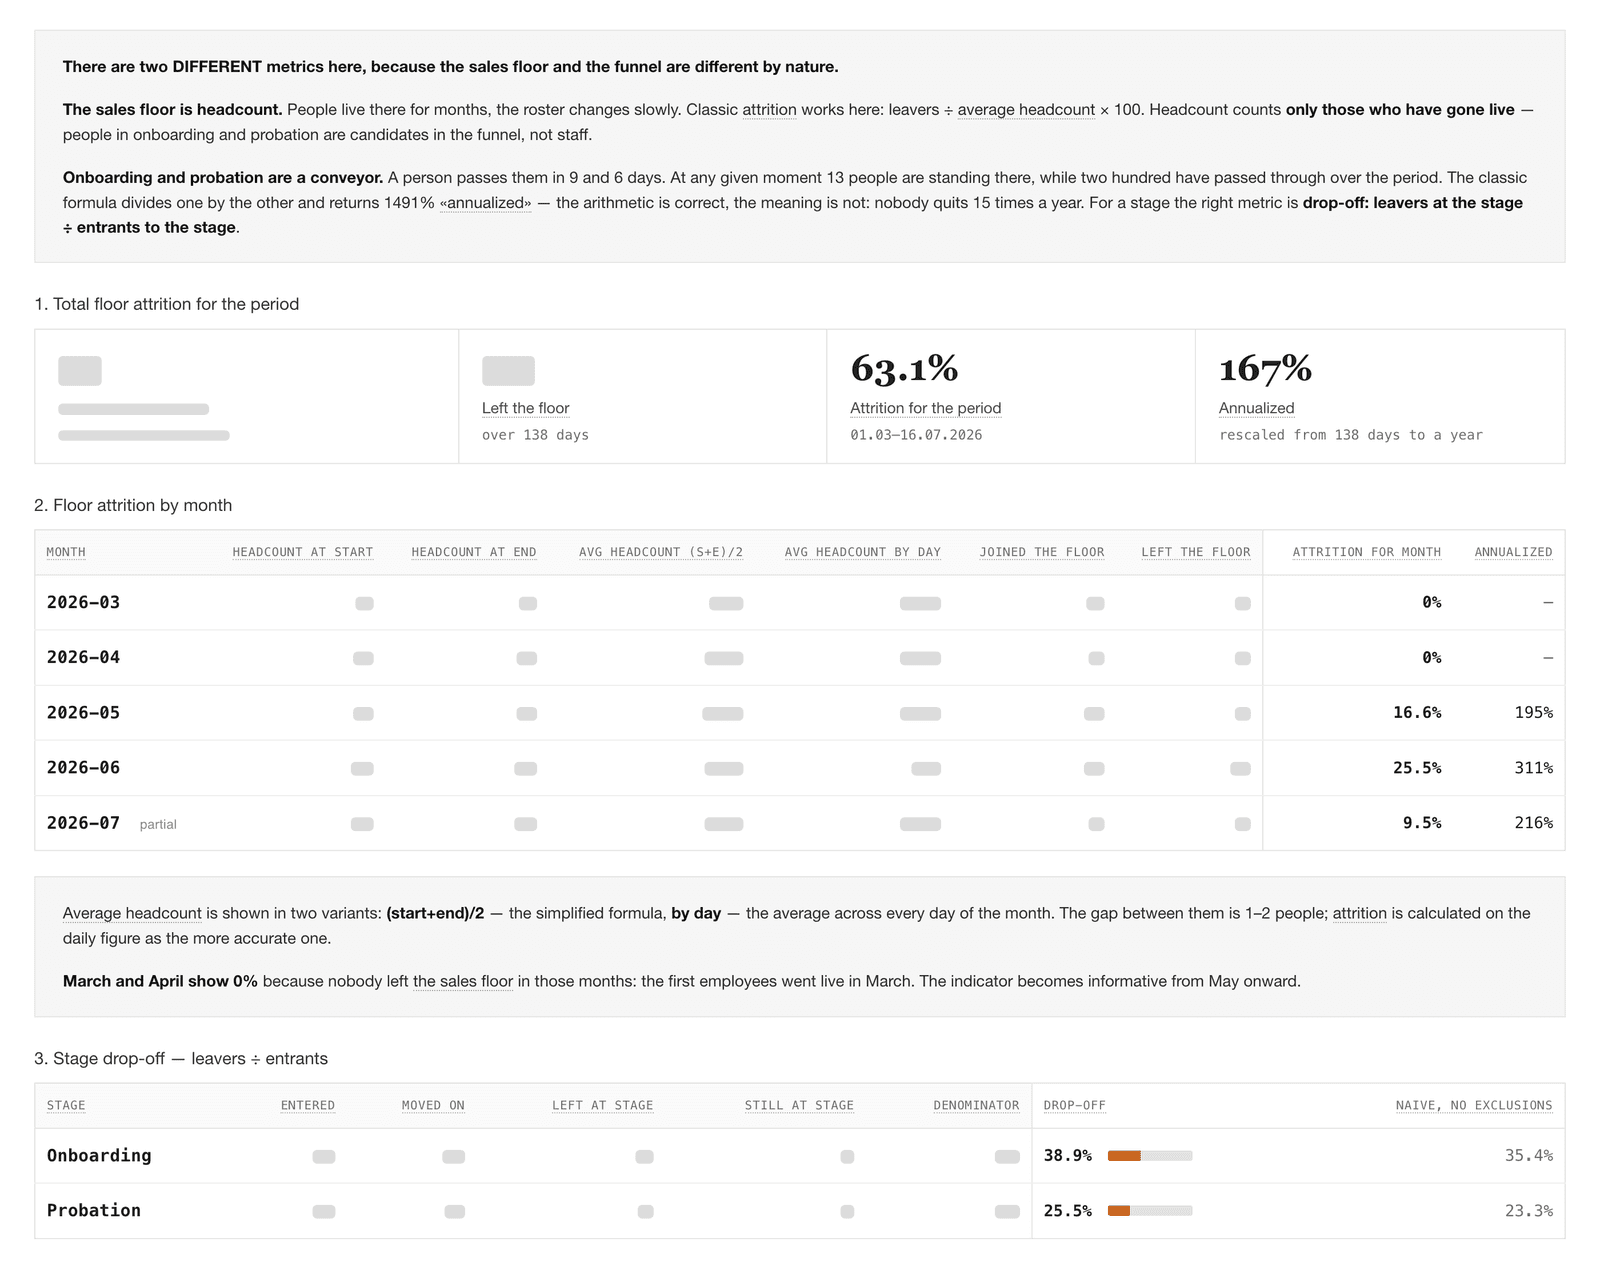
Decisions were being made on instinct. Metrics lived in scattered exports, and attrition, the funnel and payback never appeared in the same place — so nobody could tell which departures were actually a problem.
Problem
Metrics lived in a dozen scattered exports, and nobody separated the resignations we regretted from the ones we were quietly relieved about.
Solution
People analytics built from nothing: dashboards for attrition, regrettable versus non-regrettable exits, funnel conversion, LTV and payback — fed over APIs and deployed on Vercel.
How it works
Attrition Dashboard
Regrettable versus non-regrettable split, with trends by team and region.
Hiring Funnel
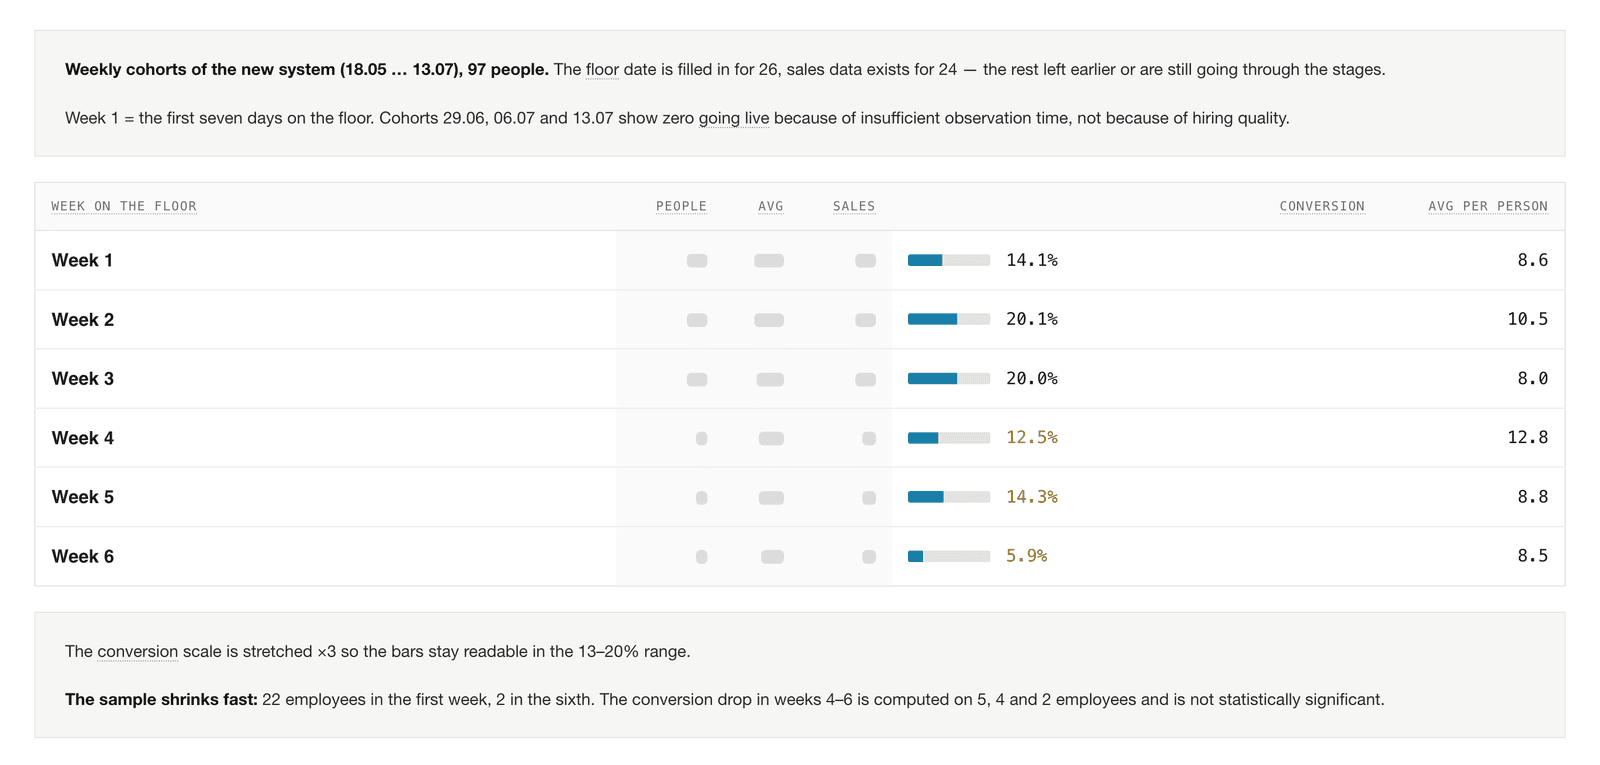
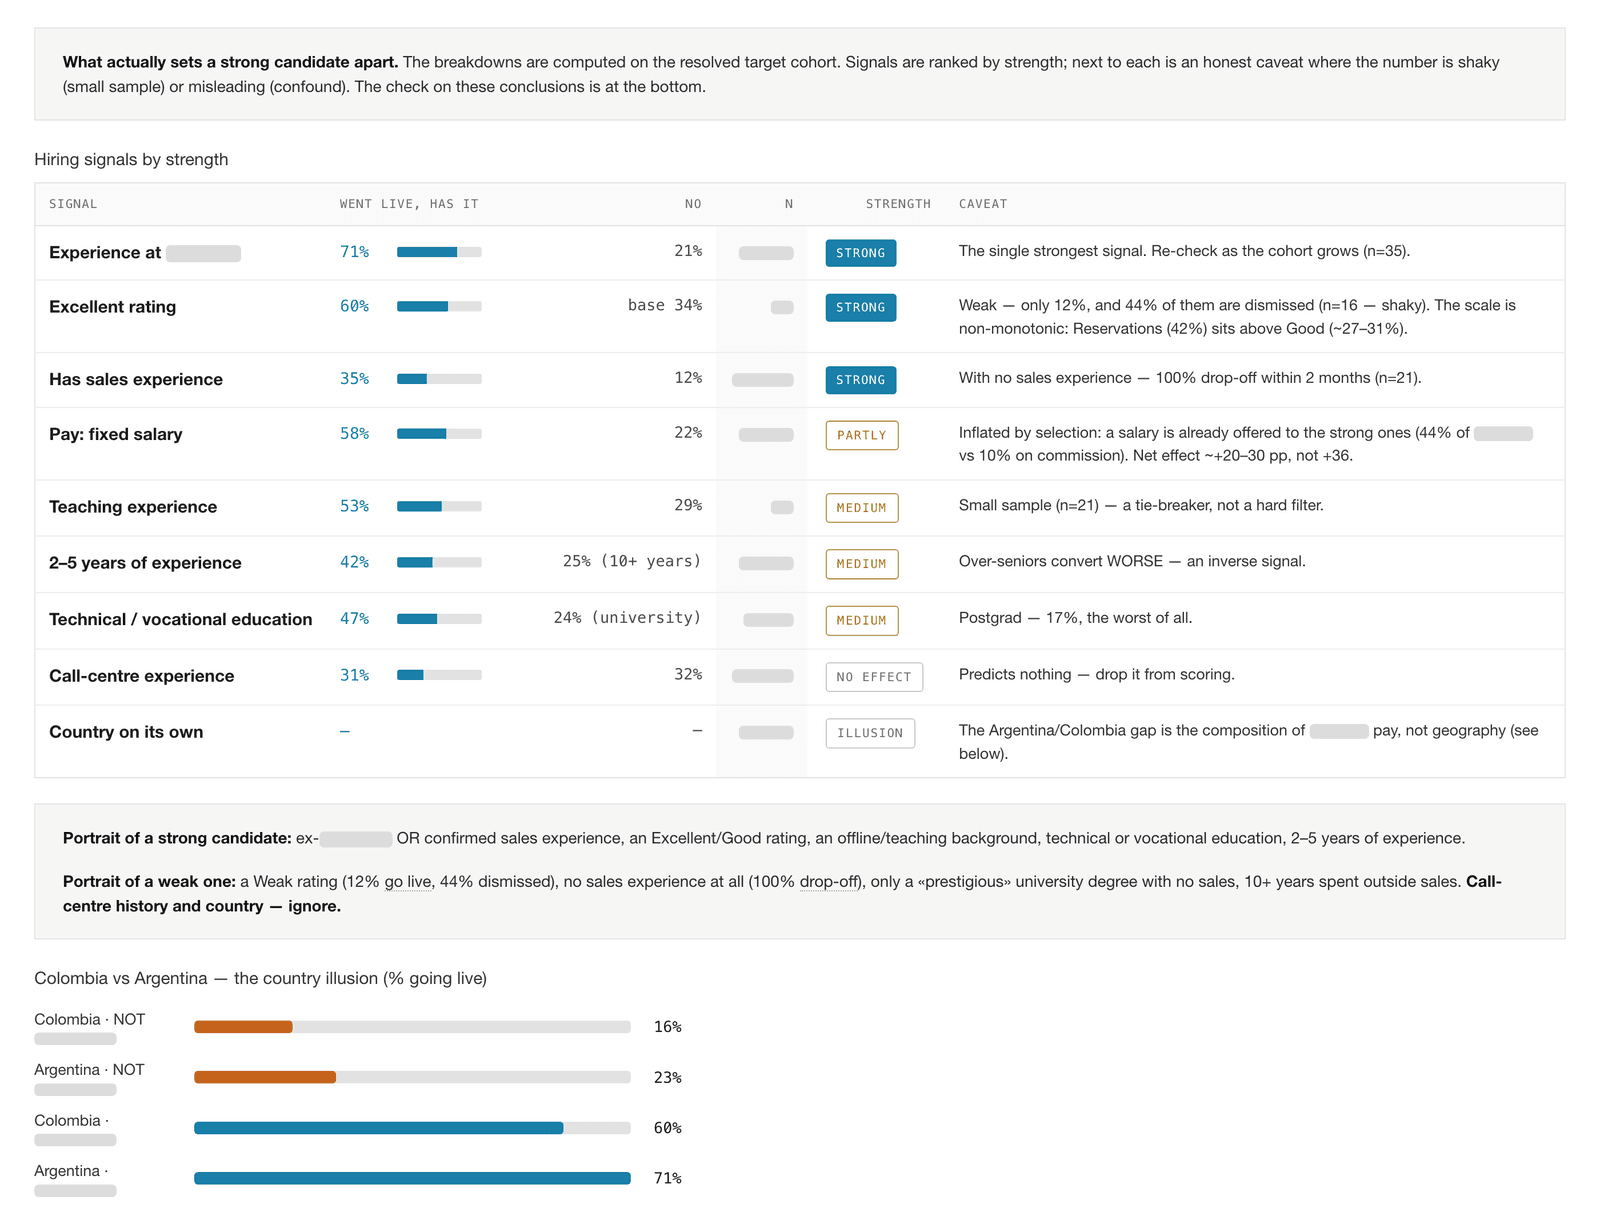
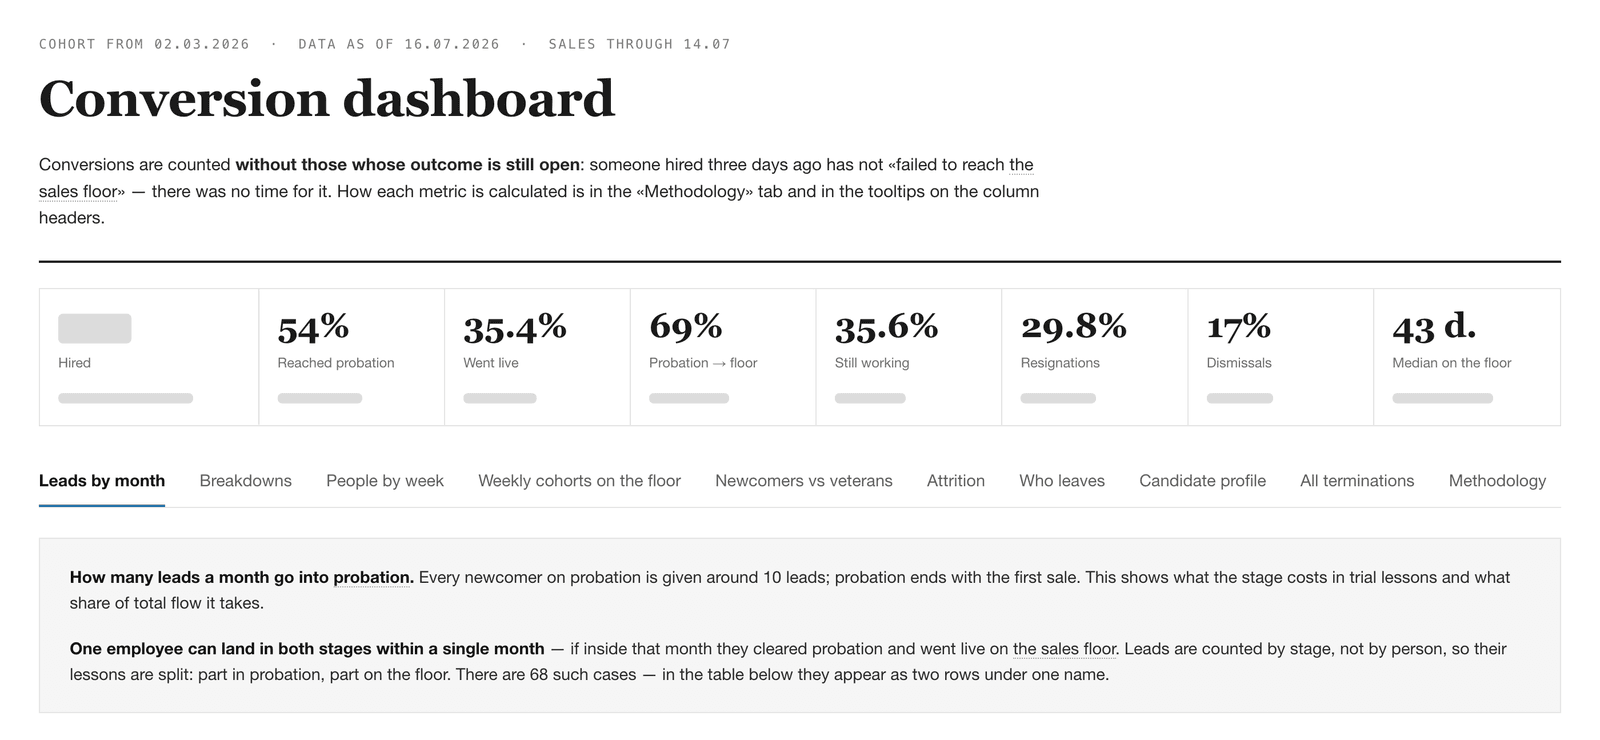
Stage-by-stage conversion, from the first lead to reaching the sales floor.
LTV and Payback
The link between what hiring and onboarding cost and what the person returns.
Data Pipeline
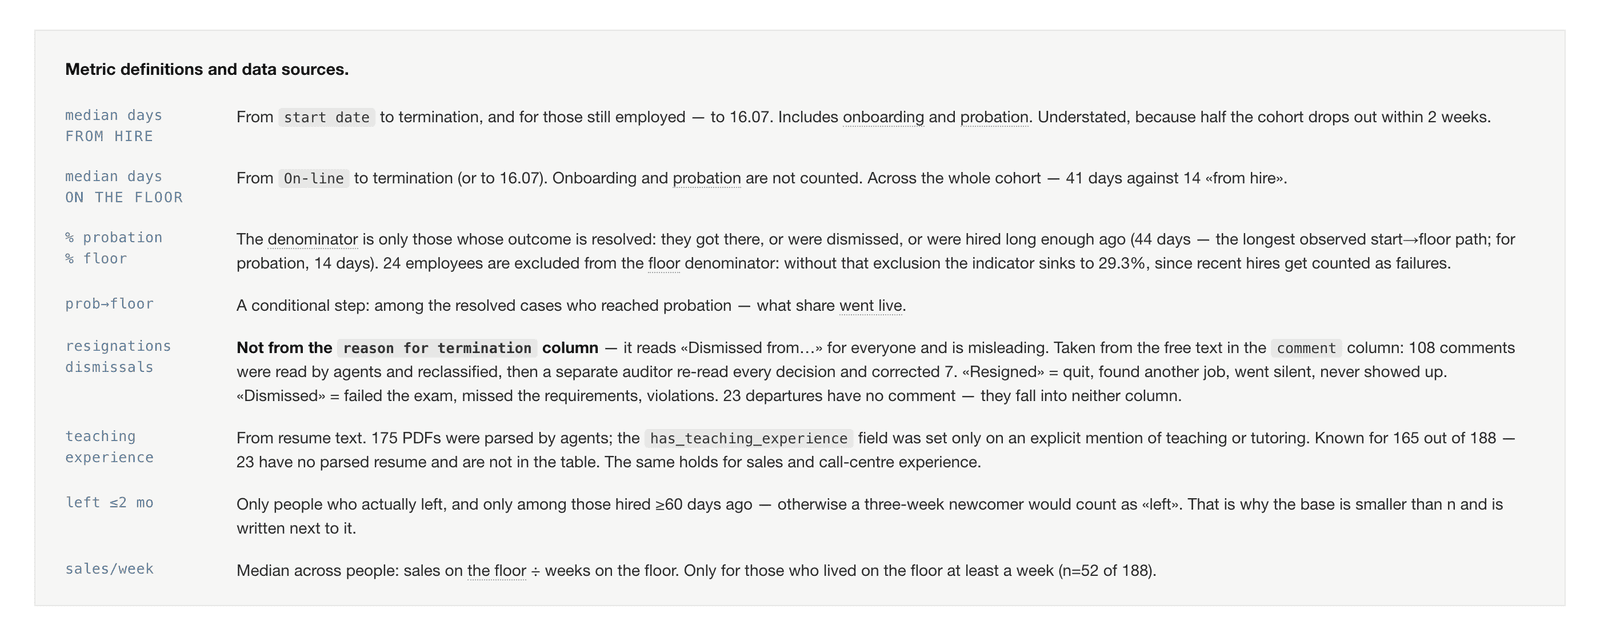
Pulled over APIs from the systems of record, instead of hand-made exports.
Deployed Dashboard
Always available at a URL on Vercel — nobody emails a spreadsheet around.
Weekly
used by CEO, HRD and team leads
3
dashboards: attrition, funnel, LTV & payback
2
exit types split: regrettable / non-regrettable