Sales Cabinet for a 60-Person Sales Team
An online school selling kids' coding and maths courses. In LATAM the sale happens on a trial class, and the people running those classes (TCMs) are a sales line of about 60 people in four teams. Pay is counted per half-month, a quincena.
Every number a seller cared about lived somewhere else: sales and revenue in Power BI, leads in amoCRM, classes in the LMS, the team roster in a hiring sheet, the bonus in a manual file. A seller could not see where they stood. A team lead had to dig through Power BI before every 1:1.
Problem
When we looked at the line data together with the CEO, conversion did not grow after the first month. People plateaued and stayed flat, and nobody saw it early, because nobody had one screen to look at. The ask from the CEO was simple: a screen for the people on the line, not for management. Revenue, conversion, a task list, me against my team.
Solution
Took it from user stories to a pilot in about six weeks (the data mart itself took 9 days) and built it myself with Claude Code: one screen per role, numbers reconciled with the source, early signals for team leads and newcomers.
- pilot users logged in during week one
- 14 of 14
- pilot users logged in during week one
- of sales in dispute, not the 20% everyone feared
- 1%
- of sales in dispute, not the 20% everyone feared
- from the spec to a reconciled data mart
- 9 days
- from the spec to a reconciled data mart
How it works
The seller's screen
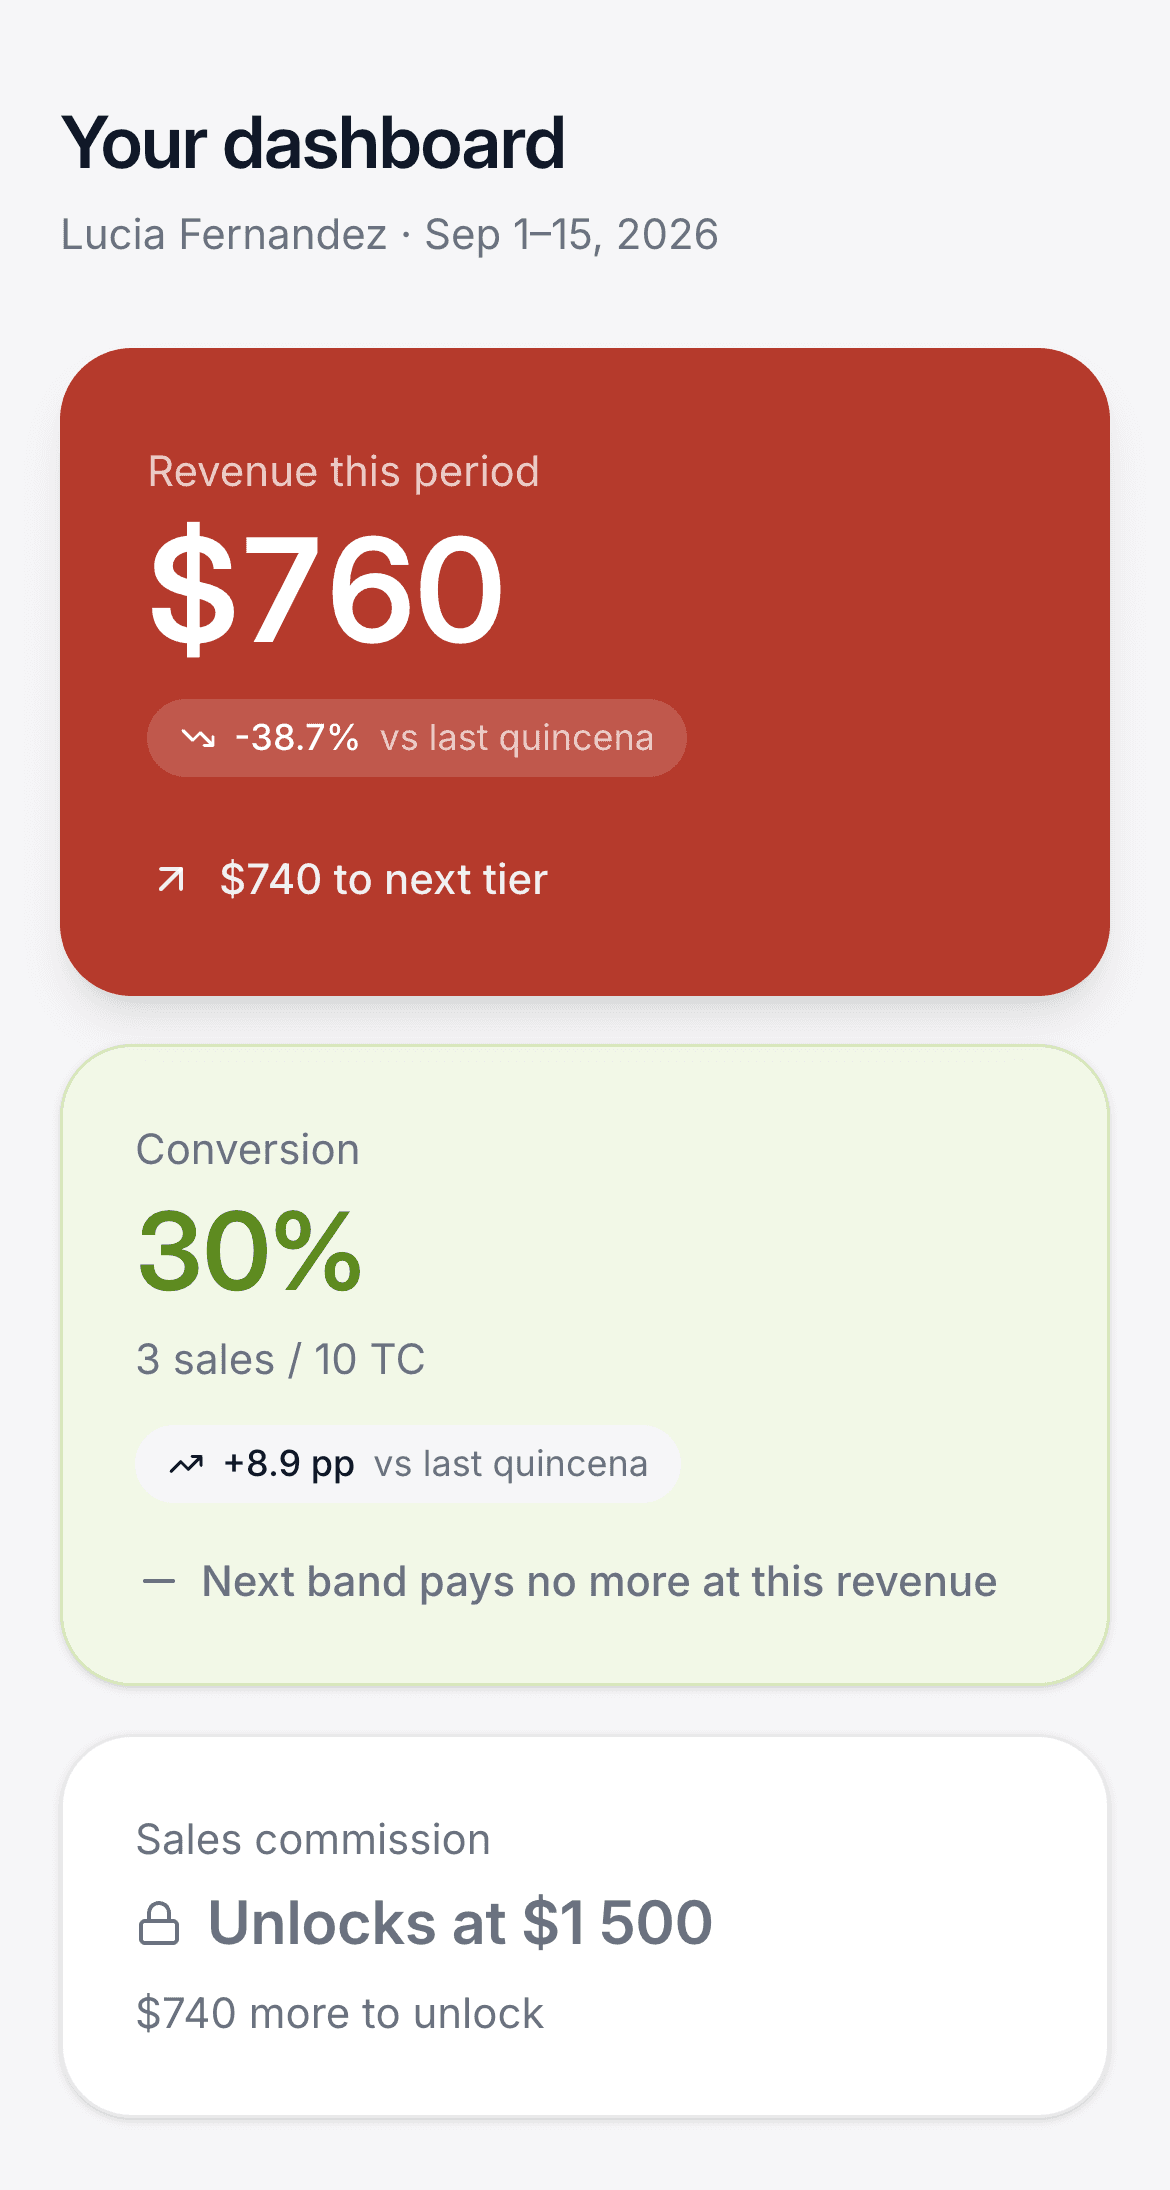
Three big numbers on top: revenue this quincena against the target, conversion, and the commission tier these two give. Below: your place in your team and the tasks for this half-month. Nothing else.
Coaching Clinic
After each closed quincena the sync checks every seller's conversion. Above 15% you are fine. Below, you move one step: ok, yellow, red. One good half-month and you are back to ok. Every step creates tasks for the seller, their team lead and the quality lead. The seller sees a direction and a target, never the word "dismissal".
Newcomer board
Probation is judged in classes, not in leads: two sales within 15 classes, signals at the 7th and 13th class, a decision at the 10th class with no first sale. Red means one thing only: a dismissal decision. Before that rule, "no leads issued" was as red as "no sales".
Honest numbers
If we could not count something, the cell is empty and says the source is not connected. Zero means we counted and found zero. Below a minimum number of classes there is no verdict: on ten classes the true conversion could be anything from 3% to 56%.
One person, many accounts
One seller can have three CRM accounts. People are matched by work email, merges are declared and never guessed. If the system is not sure whose sale it is, the sale goes to quarantine, not to the "most similar" person.
The money switch
Before launch I checked August payouts line by line, and the Power BI revenue didn't match what sellers were actually paid. So the commission block went live switched off, with a toggle in the admin page. A disputed metric is a conversation. A wrong payout on someone's screen is a trust problem.
Outcome
- 9 days from the spec to a live data mart reconciled with the source.
- Pilot in one team: all 14 users logged in during the first week. The team lead came back asking for more (a progress checklist, clearer per-seller reporting), not for less.
- Five role views from one product: seller, seller on probation, team lead, onboarding, head of sales. A team lead opening a seller sees exactly the seller's own screen.
- Found the payout gap before it reached people, and sized the sales attribution dispute at 1% of sales, not the 20% everyone feared.
- Handed over to the internal dev team with the spec, 32 documented rules and the data notes. Next step agreed by the business: merge into the sales portal.
What I did
- Wrote the user stories, then a spec: five roles, every formula, every threshold, where each number comes from.
- Agreed the metric definitions with the HR director, the head of sales and BI. Each disputed metric got an owner and a default "if nobody answers".
- Built the data layer: the corporate warehouse (amoCRM and LMS replica), the Power BI sales model and the hiring sheet, synced into a Postgres mart.
- Reconciled it against the source on a closed half-month before showing anything to anyone: every sale and every class matched.
- Built the cabinet as its own service behind the company SSO, ran a review with the head of sales and a team lead, and launched it in one team first.
- Wrote the handover for the internal dev team: 32 numbered rules the code relies on, plus a separate note on where the data does not reconcile.
Screens
My role
Product owner and builder: stories and spec, metric definitions with HR, sales and BI, data reconciliation, the service itself, the review, the pilot and the handover. AI call scoring was a separate team's product; the cabinet started inside it and I pulled it out into its own service.
Stack
Next.js (server-rendered), Postgres, Python sync worker, Power BI REST API (DAX), ClickHouse warehouse with amoCRM and LMS data, Google Sheets API, SSO, GitLab CI, Kubernetes. Built with Claude Code.
Next case
People Analytics for a Sales Hiring Funnel